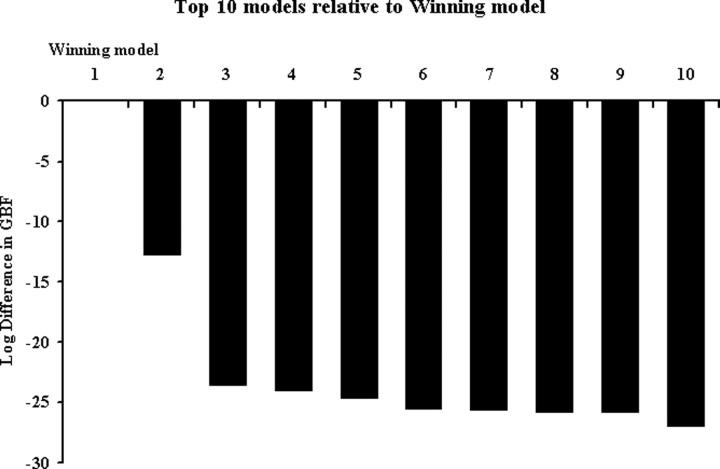
Figure 3.
Group Bayes factors. Group Bayes factors for the top 10 models that best explain the BOLD data entered into the DCM compared with the winning model (of 216 in total). The winning model is on the left (rank 1, x-axis). The y-axis represents the difference in group Bayes factors between the winning model and the next nine best-fitting models. Note that, for display reasons, the differences in Bayes factors are logged.

