
Figure 2. Example of each type of trial on the probabilistic choice task.
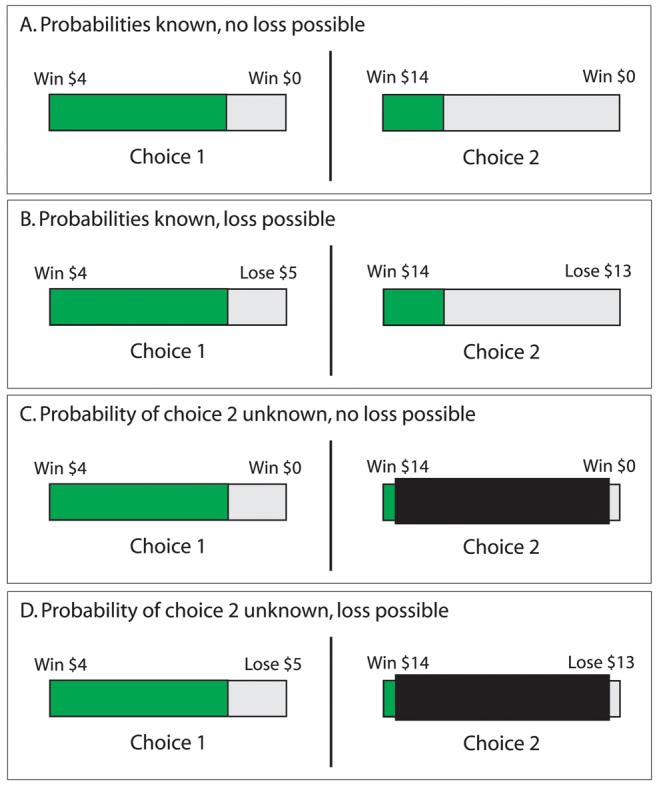
Gamble 1 in each example depicts an 80% chance of winning $4 and a 20% change of losing either $0 or $5. In half the trials, the odds of winning gamble 2 were visible. The examples show a 30% chance of winning $14, versus a 70% chance of losing either $0 (A) or $16 (B). In the remaining trials, the odds of winning gamble 2 were hidden from participants with a mask (C and D). Participants chose gamble 1 with the left button of a game controller and gamble 2 with the right.