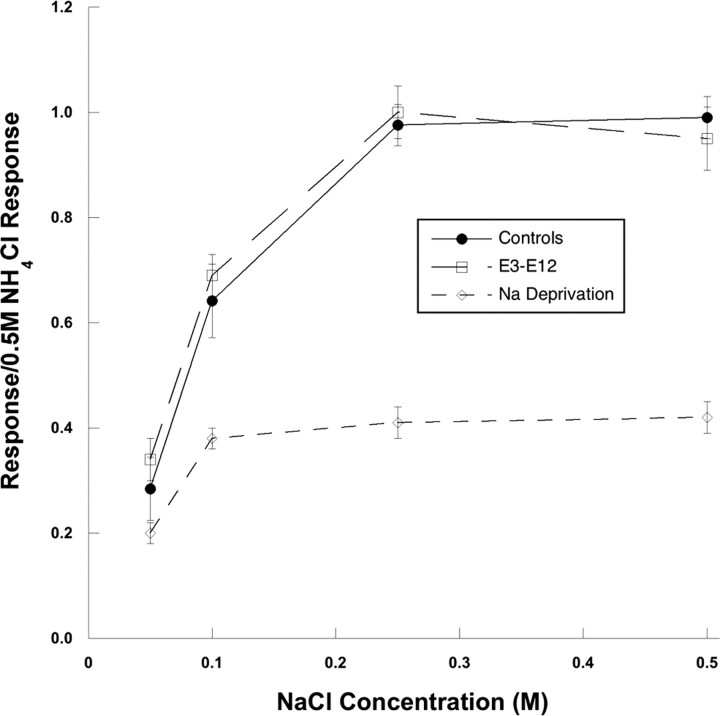
Figure 10.
Neurophysiological taste responses to NaCl. Mean (±SEM) response–concentration functions from the whole CT nerve in adult rats fed the control diet (filled line, filled circles) and rats fed the sodium-restricted diet from E3 to E12 (dashed line, open squares) are shown. Responses are also shown for the CT nerve in rats fed the sodium-restricted diet from E3 through adulthood [short dashed line, open diamonds; data taken from Hill (1987)] to show the attenuated NaCl response in rats fed the sodium-restricted diet from E3 to P28 at the time of sodium repletion. At adulthood, rats fed the sodium-restricted diet from E3 to E12 had similar taste responses as rats fed the control diet and much different than rats sodium restricted throughout development.

