
Figure 11.
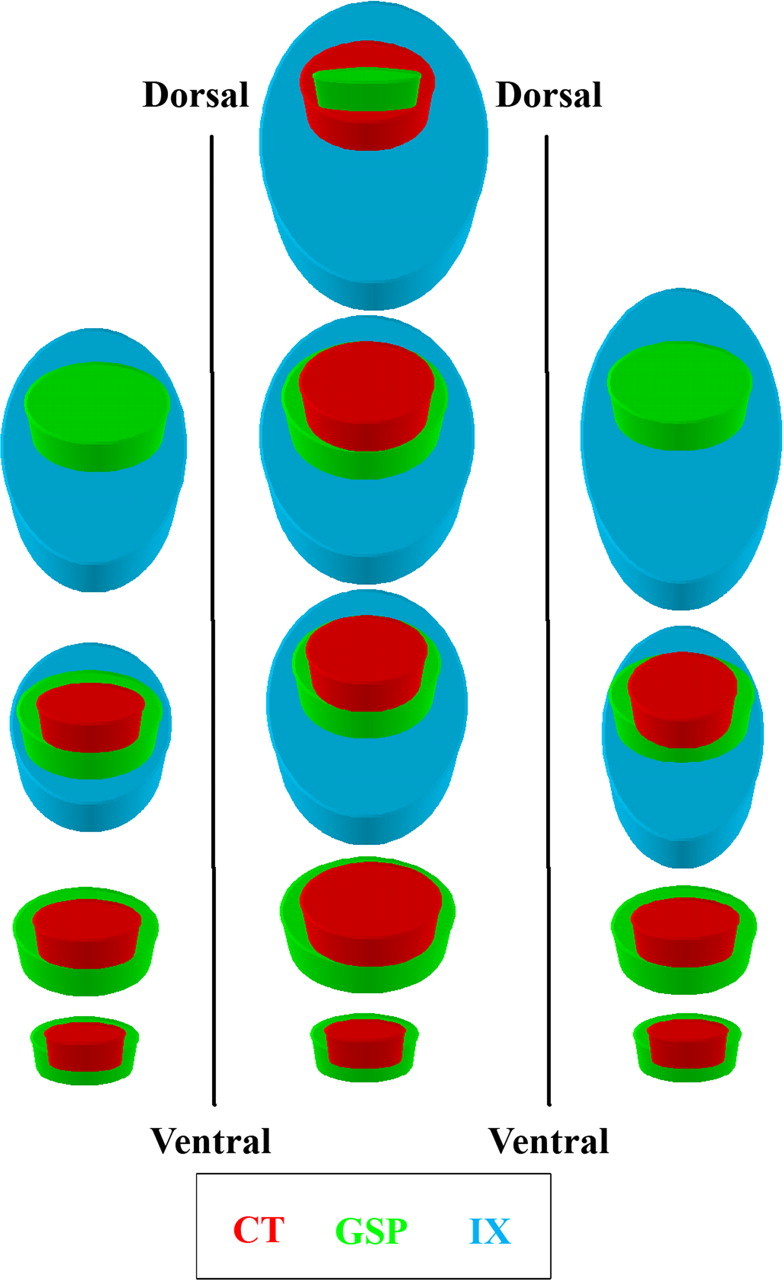
Summary model of terminal field organization. A model of terminal field organization through the dorsoventral extent of horizontal sections from the right NTS in rats fed the control diet (left column), rats fed the sodium-restricted diet from E3 to E12 (middle column), and rats fed the sodium-restricted diet from E3 to P28 (right column). Overlapping fields are represented at four levels along the dorsoventral axis. Note that there are dorsal sections that contain the terminal field in rats fed the sodium-restricted diet from E3 to E12 that are not present in the other two groups. See Results for details of the overlap among the three fields and a comparison of diet-related differences. Refer to the color key to identify individual fields among different terminal fields. Inclusion of a colored figure within another denotes overlap among the multiple terminal fields. Note that because of the orientation of the NTS within the brainstem, the term dorsal section refers to dorsocaudal, and ventral refers to ventrorostral, as depicted in Figure 6.