
Figure 2.
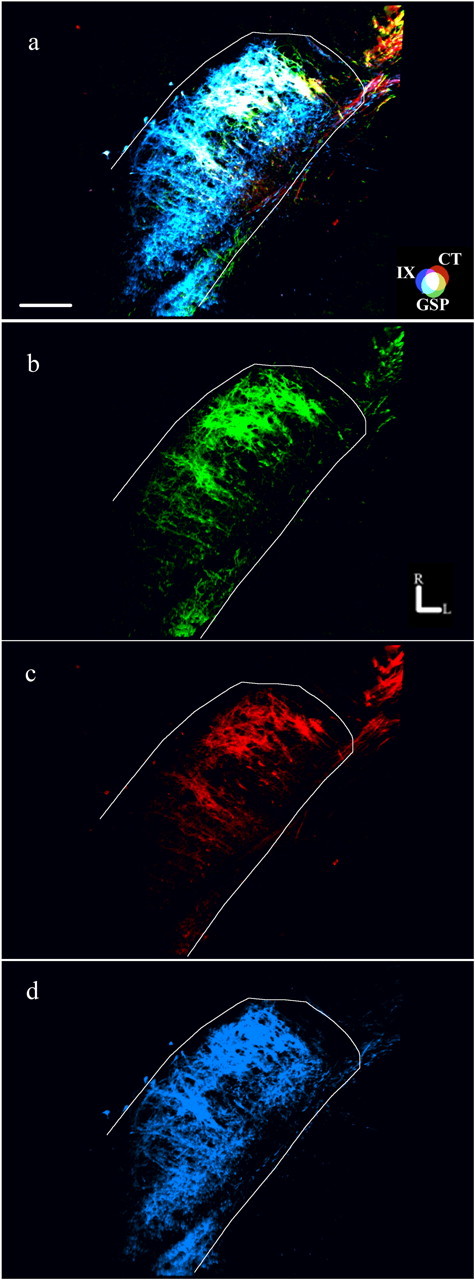
Components of fluorescent images used in analyses. Fluorescent photomicrographs showing the three merged terminal fields (a) and the component images of the GSP (green; b), CT (red; c), and IX (blue; d) terminal fields are shown. The approximate location of the NTS is outlined in white. The CT–GSP overlap is shown as yellow, the IX–GSP overlap is shown as blue-green, the IX–CT overlap is shown as magenta, and the CT–GSP–IX terminal field overlap is shown as white. Refer to the color guide in a. Rostral (R) and lateral (L) are indicated in b. Scale bar (in a), 200 μm.