
Figure 3.
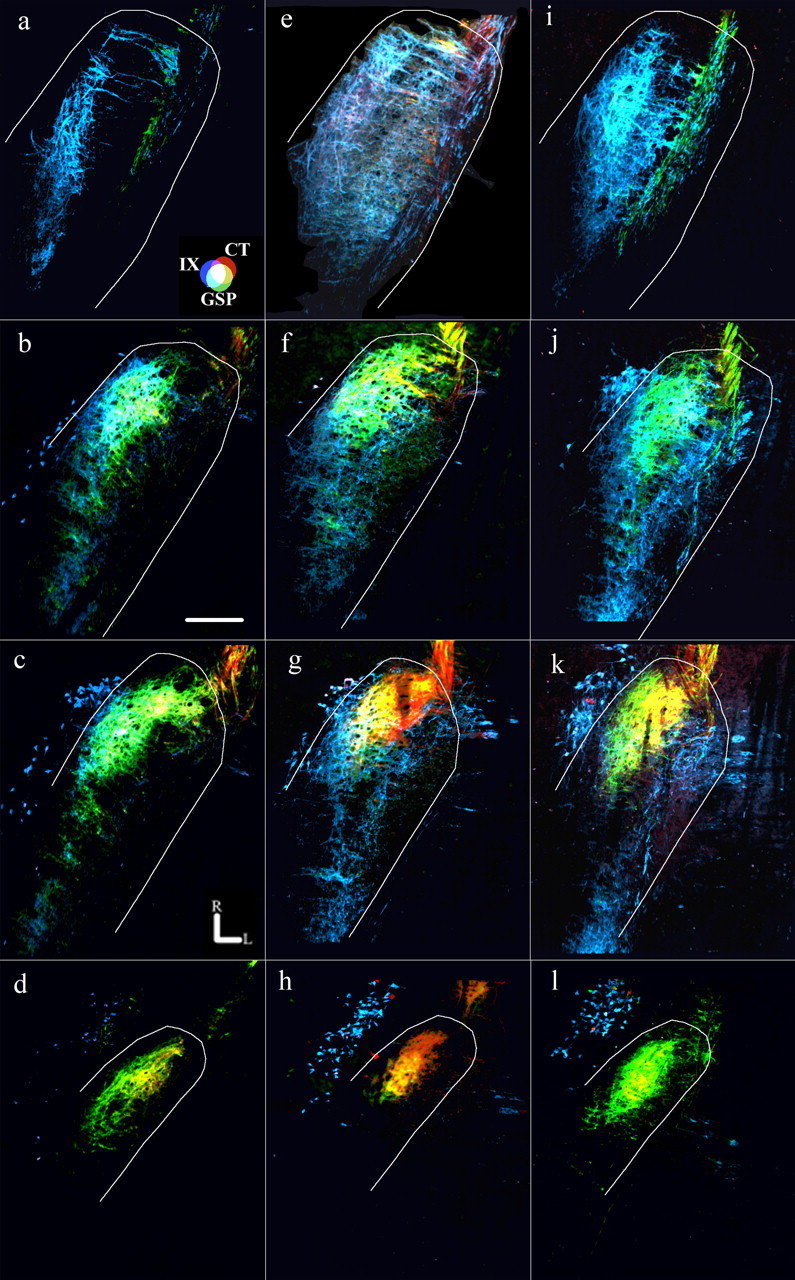
Horizontal sections of merged images from dorsal through ventral sections in the rostral NTS. Fluorescent photomicrographs of rats fed the control diet (a–d), rats fed the sodium-restricted diet from E3 to E12 (e–h), and rats fed the sodium-restricted diet from E3 to P28 (i–l) are shown. The approximate location of the NTS is outlined in white. a, e, i, The most dorsal sections are characterized by the presence of the IX terminal field and GSP fibers in the solitary tract, except in rats fed the sodium-restricted diet from E3 to E12, where the CT terminal field can be seen (e). b, f, j, Dorsal sections contain all three terminal fields, with the most overlap occurring in rats fed the sodium-restricted diet from E3 to E12 (f). c, g, k, Intermediate sections are characterized by the densely labeled oval shape of the CT terminal field and retrogradely labeled cells of the salivatory nucleus, outside and medial to the NTS. Note that in both rats fed the restricted diet from E3 to E12 (g) and from E3 to P28 (k), the IX terminal field is present, whereas it normally does not project in rats fed the control diet (c). d, h, l, Ventral sections are characterized by the presence of the CT and GSP terminal fields and retrogradely labeled cells of the salivatory nucleus. See Results for a full description of zone determination. Nerve terminal field and overlap colors are the same as noted in Figure 2 and are shown on the color guide in a. Rostral (R) and lateral (L) are indicated in c. Scale bar (in b), 200 μm.