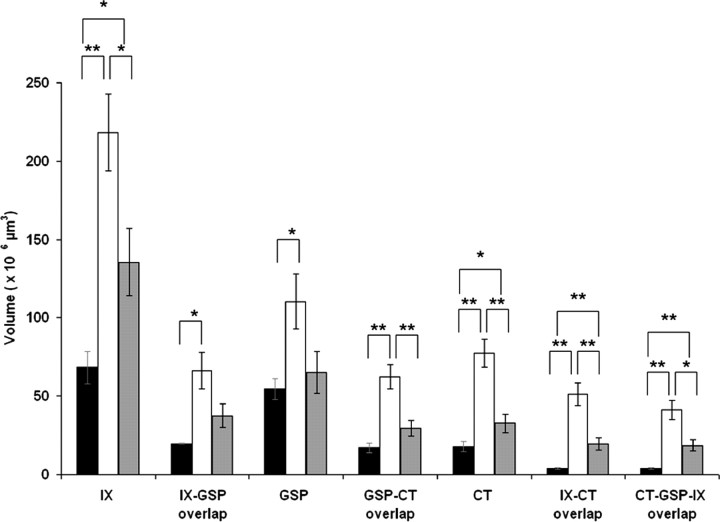
Figure 4.
Mean total terminal field volumes. Bars denote the mean total volume (±SEM) of the terminal field and terminal field overlap of control (black bars), rats fed the sodium-restricted diet from E3 to E12 (white bars), and rats fed the restricted diet from E3 to P28 (gray bars). Note that the fields of overlap are inclusive within the total terminal field volume. *p < 0.05; **p < 0.01.

