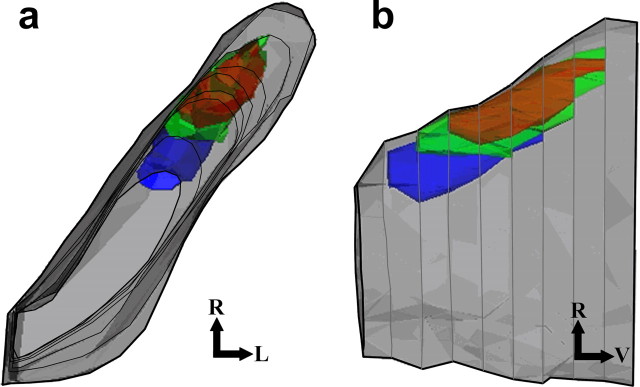
Figure 6.
Three-dimensional representation of the three primary afferent terminal fields in the NTS of rats fed the control diet from a dorsal (a) and a lateral (b) view. Terminal fields and overlap of fields are shown with respect to the NTS. The CT terminal field is shown in red, the GSP terminal field is shown in green, the IX terminal field is shown in blue, and the NTS is shown in gray. Note the rostral positions of the terminal fields relative to the entire NTS. This figure does not reproduce actual data; it is a representation of what is typically seen in an adult rat fed the control diet. Rostral (R), lateral (L), and ventral (V) are indicated.

