
Figure 7.
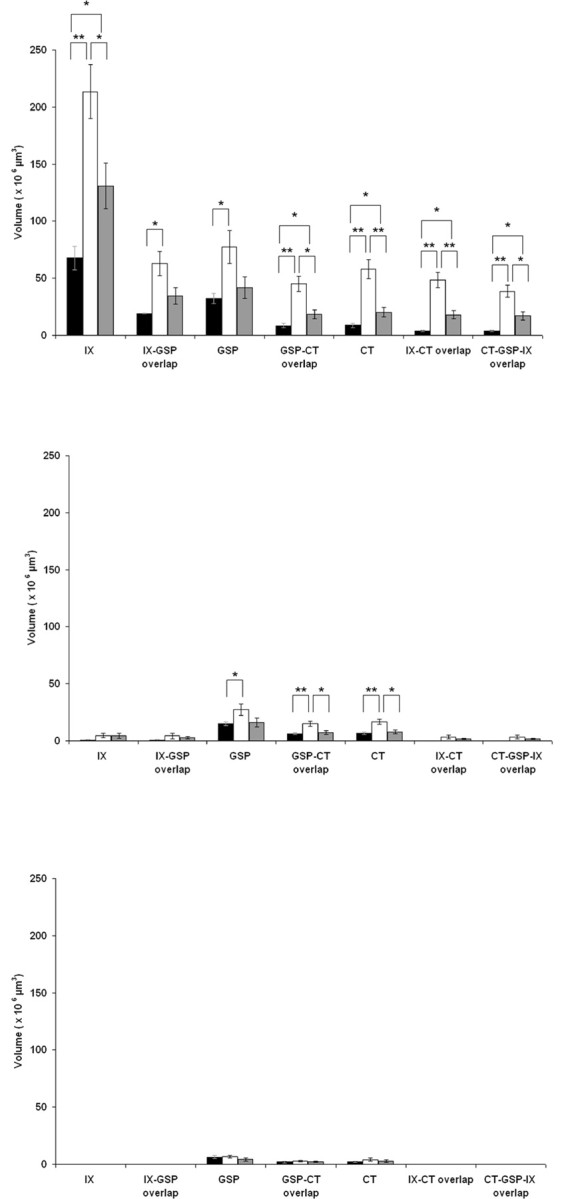
Mean zonal terminal field volumes. Zonal distribution of mean (±SEM) terminal field volumes of the GSP, CT, and IX nerves and corresponding overlap in the NTS of rats fed the control diet (black bars), rats fed the sodium-restricted diet from E3 to E12 (white bars), and rats fed the sodium-restricted diet from E3 to P28 (gray bars) are shown. Top, Dorsal zone; middle, intermediate zone; bottom, ventral zone. The most dramatic increases in terminal field volume in both experimental groups are contained within the dorsal zone. *p < 0.05; **p < 0.01.