
Figure 8.
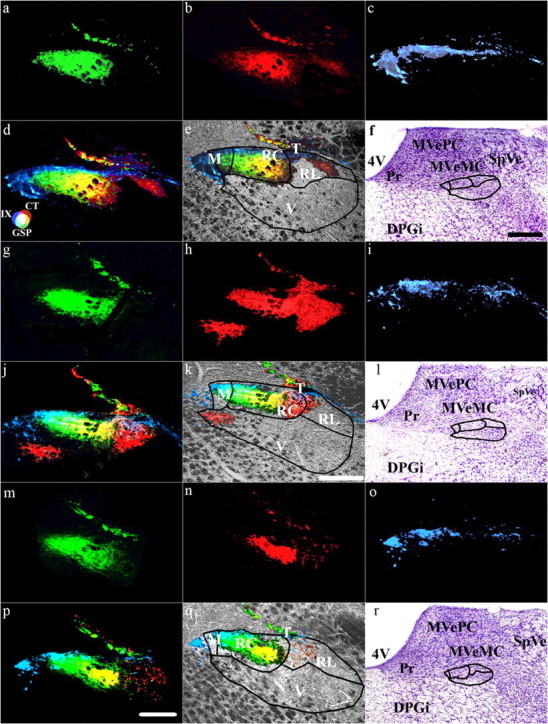
Terminal fields within subdivisions of the NTS. Coronal sections through the rat medulla in rats fed the control diet (a–f) and rats fed the sodium-restricted diet from E3 to E12 (g–l) and from E3 to P28 (m–r) show the terminal field for the GSP (a, g, m), CT (b, h, n), and IX (c, i, o) nerves. d, j, p, Merged terminal fields. e, k, q, Merged image superimposed on an image of the brainstem obtained through the transmitted light channel on the confocal laser microscope system. f, l, r, Nissl-stained tissue illustrating the location of the NTS relative to other brainstem structures. Lines in e, f, k, l, q, and r demarcate the approximate boundaries of the subdivisions in the NTS as described by Halsell et al. (1996). h, i, k, Note that the CT terminal field in rats fed the sodium-restricted diet from E3 to E12 invades inappropriate NTS subnuclei. Refer to the color guide in d to identify individual fields and overlap among different terminal fields. Scale bars: (in p) a–d, g–j, m–p, 200 μm; (in k), e, k, g, 200 μm; (in f) f, l, r, 500 μm. T, Solitary tract; M, medial subdivision of the NTS; RC, rostrocentral subdivision of the NTS; V, ventral subdivision of the NTS; RL, rostrolateral subdivision of the NTS; 4V, fourth ventricle; DPGi, dorsal paragigantocellular nucleus; MVeMC, medial vestibular nucleus magnocellular; MVePC, medial vestibular nucleus parvocellular; Pr, principal nucleus; SpVe, spinal vestibular nucleus.