
Figure 3.
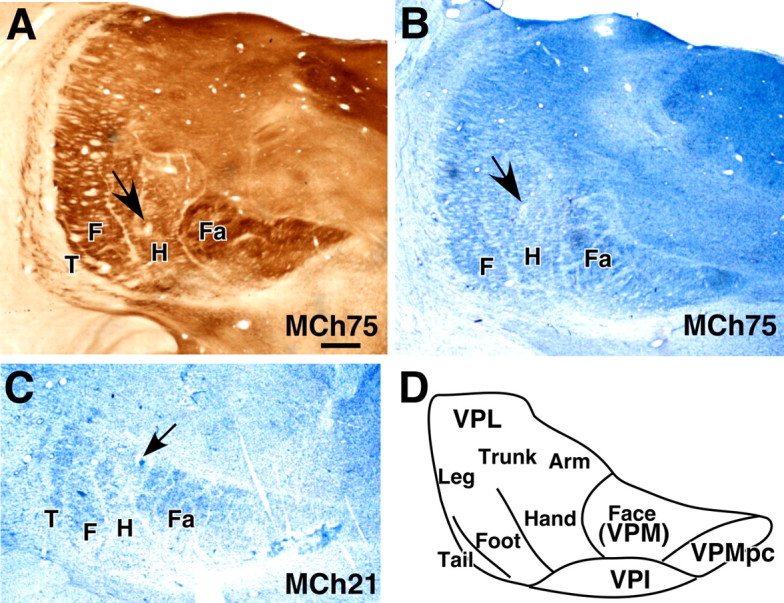
A–C, Coronal sections of the thalamus through the VP nucleus of monkey MCh75 (A, B) and MCh21 (C) showing electrolytic lesions (arrows) made to help align microelectrode recording results with histological features revealed in sections stained for cytochrome oxidase activity (A) or Nissl substance (B, C). D, Outline of the VP nucleus showing normal somatotopy. Note the lines separating the representations of major body parts can be seen as CO light septa in A and cell sparse septa in B and C. Fa, Face; H, hand; F, foot; T, tail; VPMpc, parvicellular subdivision of the VP nucleus; VPI, ventroposterior inferior nucleus. The tail subnucleus is not apparent in the section shown in B. Scale bar (in A for A, B, C), 1 mm.