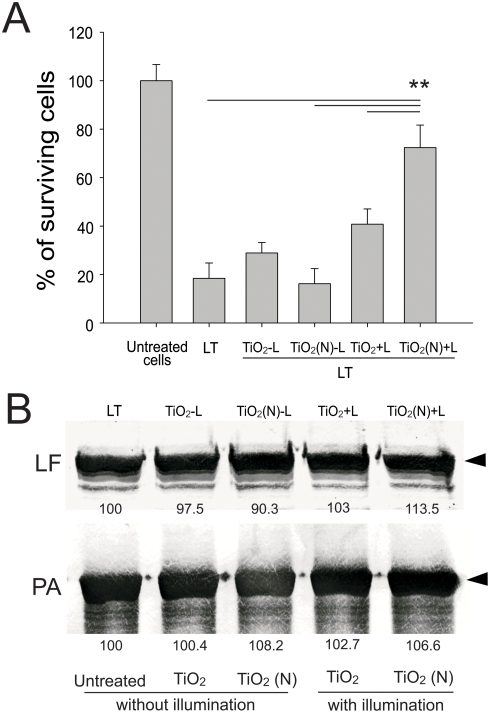
Figure 6. Cytotoxicity and Western blot analysis of photocatalyzed LT.
Macrophage J774A.1 cells were subjected to LT treatments for three hours, surviving cells of untreated groups were adjusted to 100% (A). Columns designated TiO2 or TiO2 (N) represent that LT was pretreated with photocatalysis on TiO2 or TiO2 (N) substrates, respectively, before treated to J774A.1 cells. Columns designated “+L” or “−L” represent experimental conditions with or without light illumination, respectively. **P<0.01, compared to LT, TiO2-L and TiO2 (N)+L groups (A). Western blot measurements of intact LF and PA levels (arrows) of purified LT before and after visible light induced photocatalysis; band intensities of individual LF and PA samples are shown, and respective untreated groups were normalized to 100% (B).

