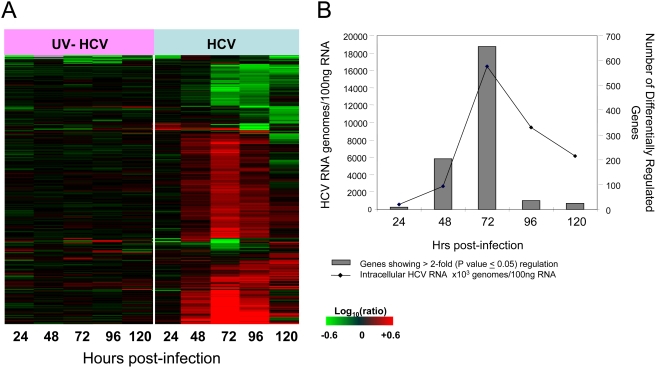
Figure 2. Host transcriptional response to acute HCV infection of Huh-7.5 cells.
(A) Expression profiles of 860 sequences that are regulated (2-fold, P value<0.05) in at least 1 experiment. Each column represents gene expression data from an individual experiment comparing either UV-inactivated HCVcc or HCVcc-treated cells relative to time-matched, mock-treated Huh-7.5 cells. Genes shown in red were up-regulated, genes shown in green down-regulated, and genes in black indicate no change in expression in HCV-infected cells relative to uninfected cells. (B) Association between intracellular HCV RNA levels and effect on host gene expression in HCV-infected Huh-7.5 cells. Intracellular HCV RNA levels were determined by quantitative RT-PCR as described in Materials and Methods. Total number of genes showing differential regulation (2-fold, P value<0.05) in HCV-infected cells relative to uninfected cells is shown in black line while the HCV viral load are shown using grey bars. Cells exposed to UV-inactivated HCVcc show negligible virus and gene expression changes and so are not shown.

