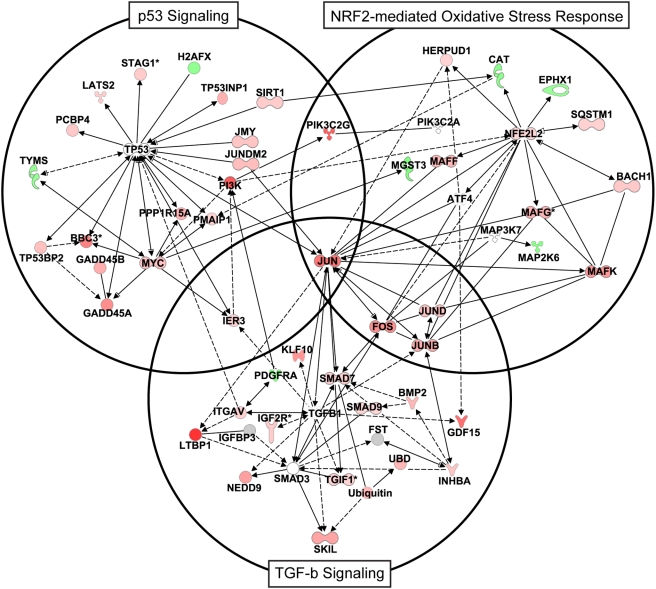
Figure 6. Ingenuity network diagram depicting interactions between the components of the p53, TGF-β1, and NFR2-mediated oxidative stress signaling pathways.
Lines indicate known interactions between proteins (sold lines depicts direct and dashed lines depict indirect interaction). Gene expression data from 72 hrs post-infection was overlaid onto the network with genes showing increased and decreased expression (relative to mock) shown in red and green, respectively. For visualization, network was mainly restricted to genes showing regulation during infection and not all interactions between genes from different pathways are indicated.

