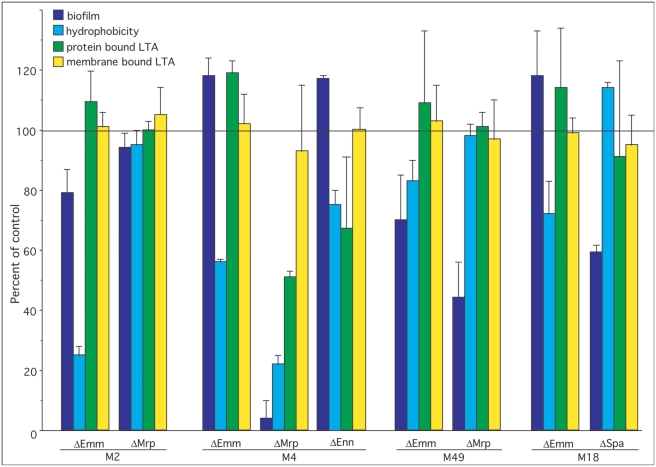
Figure 5. Effect of inactivation of emm, mrp, enn or spa in patterns C, D, and E serotypes on biofilm formation, hydrophobicity, and LTA expression.
The values for wild type parental strain was used as the control and set at 100% and the data for mutants are provided as percent of control (data from table 1). The horizontal line at the 100% mark represents the values for parental controls, which are not individually shown.

