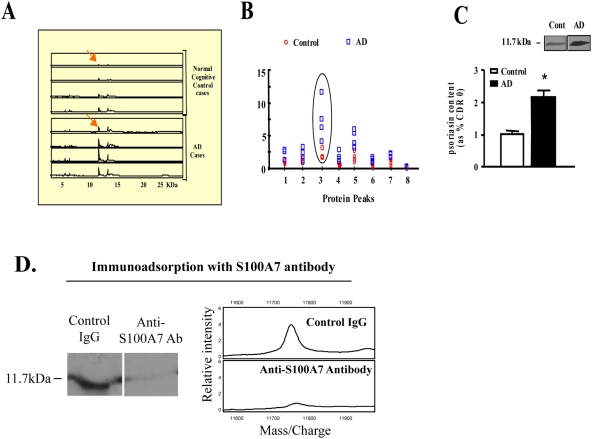
Figure 1. Identification of biomarkers in the CSF of AD cases.
For the study, CSF was collected by lumbar puncture (n = 4 per group), centrifuged (1,300×g) at 4°C, aliquoted and stored at −80°C. 4 µg of CSF proteins from each case was analyzed by SELDI technology using the IMAC-Cu++ protein chip; only Cu++-binding proteins are analyzed using this chip. A, SELDI retention map; “peaks” represent individual detected proteins, and the area under the peak represents the signal intensity. Reference molecular sizes are indicated across the bottom of the panel. B, molecular weight frequency scatter graph indicating the quantitative distributions of individual Cu++-binding protein for each of the cases analyzed. Peak #3 shows the levels of expression of the 11.7-kDa species in the AD dementia and normal cognitive controls. C, western blot confirmation of elevated S100A7 contents in the CSF of AD cases. Bar graph represents mean±SEM and is shown as % of the control group; *P<0.05, by 2 way t-test, n = 4–7 per group. Inset: representative S100A7 western blot analysis. D. Immunoadsorption with the S100A7 antibody showed no visible bands in a western blot.

