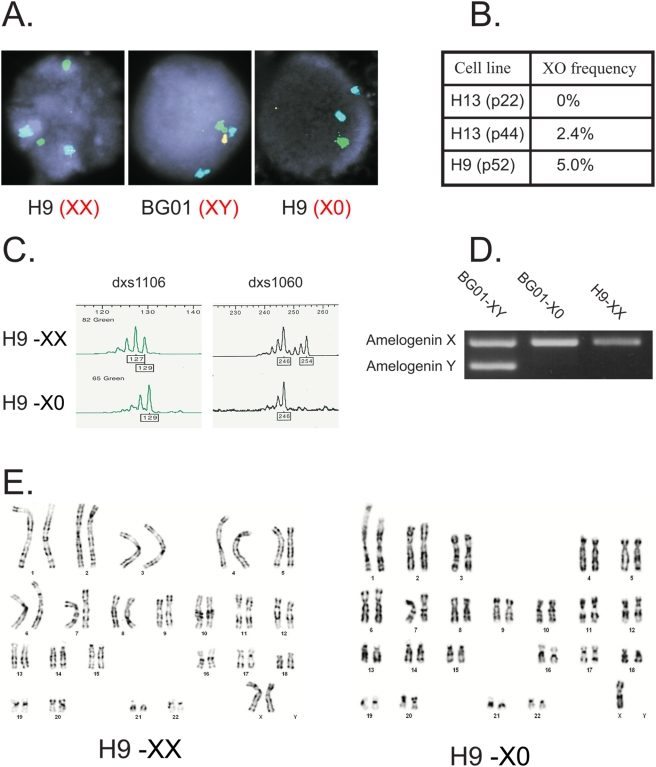
Figure 1. Isolation of XO clones from XX and XY HESCs.
A. The frequency of X or Y chromosome loss in HESCs were estimated by FISH analysis. Shown are results for X chromosome (Green) Y chromosome (Yellow) and chromosome 17 (Blue), for H9 (XX) cells, BGO1 (XY cells) and a clone of H9 that has lost one of its X chromosomes. B. Summary of the % of XO cells analyzed by FISH. The analyzed samples were either male H13 cells passage 22 and passage 44, or female H9 cells, passage 52. In each experiment 200 cells were analyzed. C. Analysis of two polymorphic markers (DXS1106 and DXS1060) on the X chromosome that are heterozygous in H9 cells. XO cells retain only one of the markers. D. PCR products of primers that distinguish between Amelogenin X and Amelogenin Y genes. XY cells (BG01) have two products whereas XX cells (H9) have only one product. XY cells that have lost the Y chromosome amplify only one band. E. Karyotype analysis of XX and XO cells. Note that in the XO cells only one X chromosome is shown.

