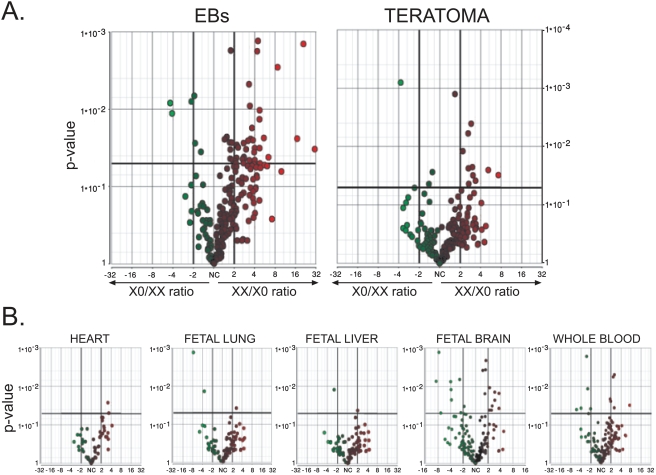
Figure 3. Comparison of gene expression in WT and in XO cells upon in vitro and in vivo differentiation.
Gene expression levels were determined by U133A DNA microarray. Every dot represents one probe in the DNA microarray. In each plot the X axis represents fold induction in the expression levels of WT cells over XO cells (right side of the scale) and of Xo cells over WT cells (left side of the scale). The Y axis represents the P-value for each gene. For more details on the bioinformatic analysis see Materials and Methods. A. Analysis of genes specific to the placenta. B. Analysis of genes specific to the heart, fetal lung, fetal liver, fetal brain and whole blood. EBs – in vitro differentiation of HESCs. Teratoma – in vivo differentiation of HESCs. Solid vertical lines represents>2 fold higher level of expression solid horizontal line represent P-value = 0.05.

