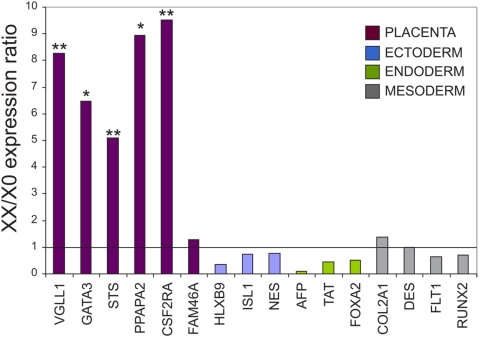
Figure 4. Confirmation of the DNA microarray data by qRT-PCR.
Relative expression levels of WT vs. XO cells for several genes enriched in either the placenta, or in tissues that correspond to the ectoderm, endoderm or mesoderm embryonic germ layers. The genes were analyzed by qRT-PCR. The solid line represents equal expression in WT and XO cells. * represents p value<0.05 and ** represents p value<0.01.

