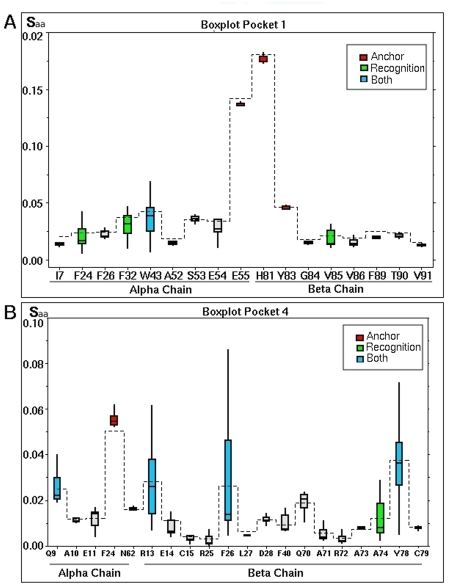
Figure 3. Boxplot analysis of Saa for each amino acid defining a pocket.
The x-axis shows amino acids according to their position in the α and β-chain. The mean value of each data series are joined by a dashed line. The median value is the line into the box. Amino acids are classified according to their electrostatic effect which is represented by different colors: anchoring amino acids are shown in red; amino acids having a recognition effect in blue, amino acids having a dual effect are shown in green whereas those not having a notable electrostatic variation are shown in gray. The box plot analysis of Pocket 1 is illustrated in panel (A) while the analysis for Pocket 4 is illustrated in (B). The same analysis was performed for the remaining pockets (data not shown).

