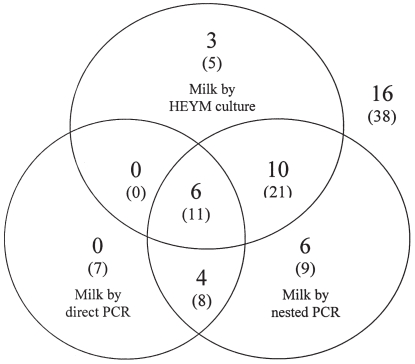
Figure 2.
Identification of 45 positive samples (without parenthesis) by fecal culture and their conjunction with samples as identified by other 3 methods (in parentheses) used for milk samples (N = 99). For example, at the center of the chart 11 (in parentheses) represents samples identified as positive by all the 3 methods employed for milk, and among them, 6 were also identified positive by fecal culture. The upper right corner shows 38 (in parentheses) samples that were negative by all the 3 methods for milk, while 16 of them were identified as positive by fecal culture.

