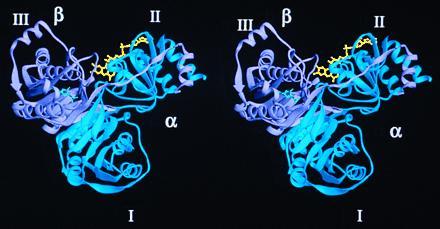
Figure 1.

A stereo ribbon diagram of the human ETF structure. FAD (yellow) binds in a cleft formed by the α (blue) and β (lavender) subunits. The AMP (green) is located entirely within the β subunit. All ribbon models were made with the program ribbons (29).
