Figure 4.

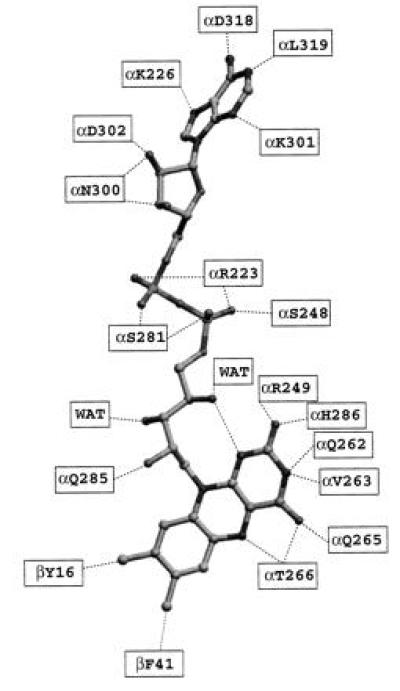
Residues involved in binding the FAD cofactor of ETF. Dotted lines indicate residues (or solvent) that are within hydrogen bonding distance (<3.3 Å) of one another. WAT denotes ordered water molecules. FAD is shown as it is modeled in ETF.

Residues involved in binding the FAD cofactor of ETF. Dotted lines indicate residues (or solvent) that are within hydrogen bonding distance (<3.3 Å) of one another. WAT denotes ordered water molecules. FAD is shown as it is modeled in ETF.