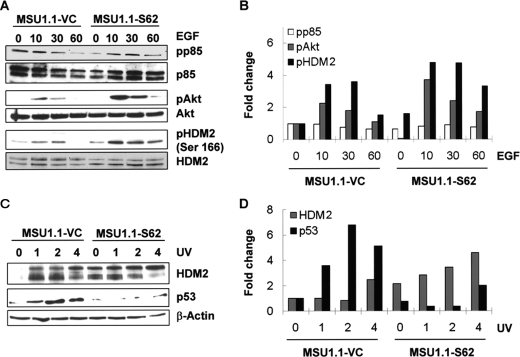
FIGURE 3.
Effect of Spry2 overexpression on the activation of Akt, HDM2, and p53. A and B, a vector control cell strain, MSU1.1-VC, and a cell strain overexpressing Spry2, MSU1.1-S62, were treated with EGF and analyzed as in Fig. 2, A and B. pp85, phospho-85; pAkt, phospho-Akt; pHDM2, phospho-HDM2. C and D, the indicated cell strains were exposed to UV radiation as above and analyzed as in Fig. 2, C and D.

