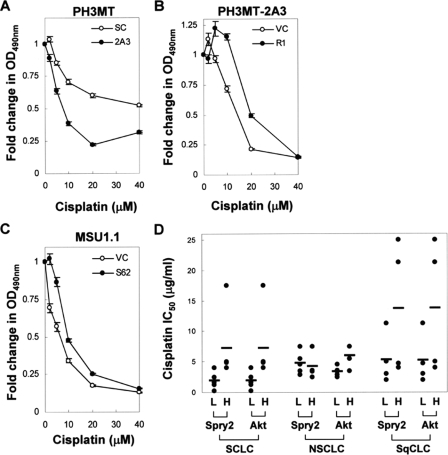
FIGURE 5.
Effect of Spry2 in cisplatin cytotoxicity. A–C, the PH3MT, PH3MT-2A3, and MSU1.1 cell strains were treated with cisplatin at a concentration of 0, 2, 5, 10, 20, and 40 μm concentrate for 6 h, allowed to grow under normal conditions for 24–48 h, and assayed for cisplatin cytotoxicity as described under “Experimental Procedures.” The number of cells is proportional to the optical density at 490 nm (A490 nm). The -fold decrease in A490 nm, relative to the untreated samples, is shown. For each panel, a representative of three independent experiments (in each n = 4) is shown. Where error bars are not shown, they are within the data point. D, a public data set from a previous study measuring genetic changes associated with cisplatin resistance in lung cancer was mined to determine the association between Spry2 expression and increased cisplatin IC50. Cell lines derived from patients with small cell (SCLC), squamous cell (SqCLC), or non-small cell (NSCLC) lung cancer were sorted according to their relative Spry2 expression. For each cell line, the expression of Spry2 and Akt is reported as a dichotomous variable, i.e. either high (H) or low (L), depending on whether the level of these genes in that cell line was greater or less than their median expression in the entire subset. Each circle represents a cell line, whereas the bar represents the average IC50 for that group. A similar analysis was performed for Akt expression.

