FIGURE 2.
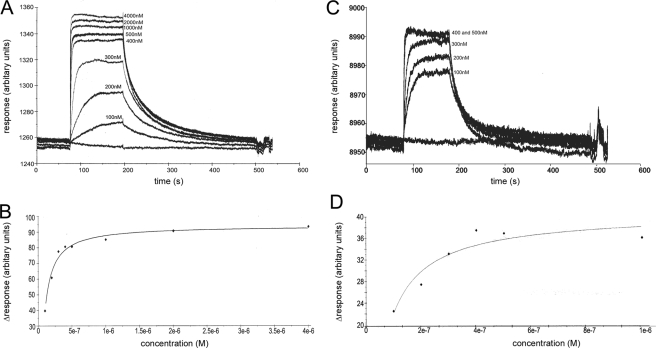
SPR measurements of IsdHN1 binding to MetHb and Hp. A, representative SPR data of wild-type IsdHN1 binding to immobilized MetHb. The panel shows an overlay of several experiments in which the concentration of IsdHN1 was varied (0, 100, 200, 300, 400, 500, 1000, 2000, and 4000 nm). Each curve is a plot of the RU as a function of time. B, representative binding curve of the wild-type IsdHN1 for immobilized MetHb. The curve was generated from the data in panel A by plotting the RU value measured 1 s before dissociation for each concentration of IsdHN1. The solid line shows the best fit of this data to obtain the KD of binding. C, representative SPR data of wild-type IsdHN1 binding to immobilized Hp. The results of six independent experiments are superimposed and differ in the concentration of concentration of IsdHN1 (0, 100,200,300,400,500, and 1000 nm IsdHN1). D, representative binding curve of wild-type IsdHN1 for immobilized Hp by plotting the RU value measured 1 s before dissociation for each concentration of IsdHN1.

