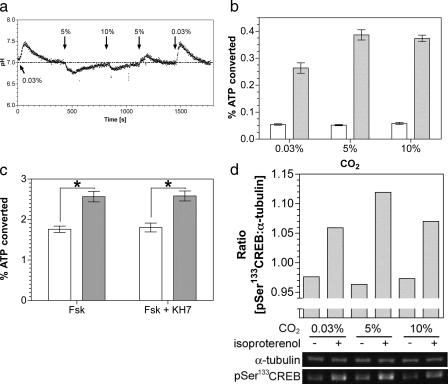
FIGURE 5.
Stimulation of a G-protein regulated AC by CO2in vivo. a, monitoring of HEK 293T cell pHi in response to changing CO2. b, percentage conversion of ATP into cAMP in HEK 293T cells exposed to varying CO2 under basal conditions (empty bars) or in the presence of 50 nm isoproterenol (filled bars)(n = 12). c, percentage conversion of ATP into cAMP in HEK 293T cells exposed to air (0.03% CO2; open bars) or 5% (v/v) CO2 (filled bars) with 5 μm forskolin and 1 μm KH7 (n = 12; *, p < 0.05). d, lower panel shows immunoblot of HEK 293T cell material after treatment with and without isoproterenol at varying CO2. The upper panel shows the ratio of phospho-CREB:α-tubulin bands from the quantified bands.

