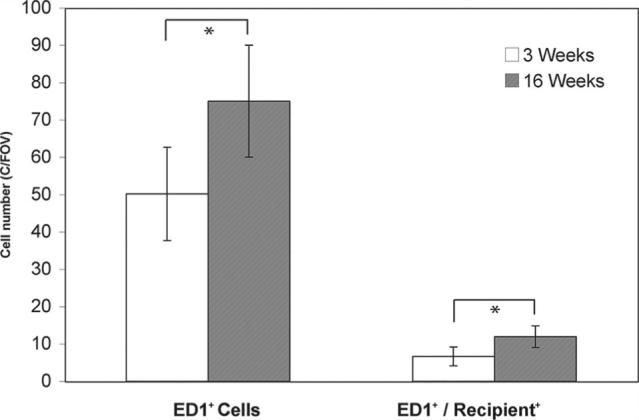
Figure 8.

Quantification of total macrophage and recipient macrophage cells infiltrated into grafted hearts at 3 weeks and 16 weeks after transplantation. Cell numbers were counted on 5 randomly chosen fields per section of the double immunofluorescent staining images. Cells that exhibit both ED1 and RT1.Aa,b,l (recipient marker) fluorescence were considered recipient macrophages. The counting was performed in a blinded manner at a magnification of ×200. Data are graphically presented as mean±SD. *P<0.05 was considered statistically significant. The amount of ED1-positive cells and recipient macrophages present in the allograft significantly (P = 0.003 and P = 0.0026, respectively) increases as CR progresses between 3 and 16 weeks.
