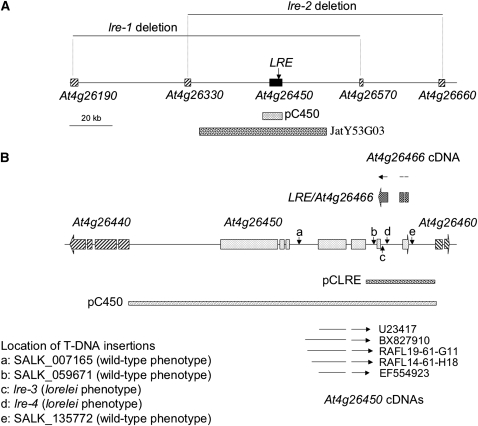
Figure 2.
Structure of the LORELEI Locus and Its Vicinity.
(A) A schematic view of the region of chromosome 4 showing the position of At4g26450 and At4g26466 as well as the extent of the deletions present in lre-1 ad lre-2. The sequences covered by the complementation constructs JatY53G03 and pC450 are displayed as well.
(B) Close-up drawing of the At4g26450/At4g26466 locus. The map shows the structure of At4g26450 (seven exons, light gray boxes on the map) and At4g26466 (three exons, dark-gray boxes above the map) as annotated by the Arabidopsis Genome Initiative consortium as well as the two bordering genes, At4g26440 and At4g26460. The full-length cDNAs for At4g26450 present in the database are shown (as arrows indicating the exons, below the schematic) as well at the cDNA for At4g26466 (arrow above the schematic) produced during this work. Furthermore, the positions of the five T-DNA lines investigated are also marked by the vertical arrows. The two T-DNA lines with an lre phenotype (lre-3 and lre-4) are marked as c and d. The three other lines had a wild-type phenotype. Finally, the length of complementing constructs pC450 and pCLRE is also displayed.

