Figure 3.
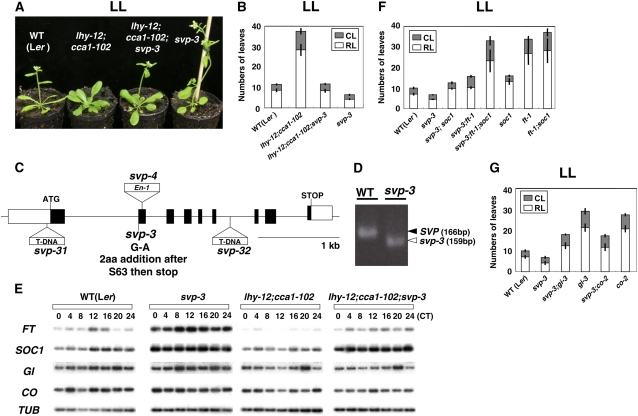
The svp Mutation Suppressed the Late-Flowering Phenotype of lhy;cca1 and Increased FT and SOC1 Expression in LL.
(A) Appearance of Ler wild type, lhy-12;cca1-101, lhy-12;cca1-101;svp-3, and svp-3 plants in LL.
(B) Flowering times of plants shown in (A).
(C) The svp alleles in Arabidopsis. Black boxes represent exons, white boxes represent noncoding DNA, and black lines represent introns.
(D) Missplicing of SVP in svp-3. Exons 1 to 3 of SVP of the wild type and svp-3 were amplified by RT-PCR. Different sizes of RT-PCR products are indicated by black and white arrowheads in the wild type (166 bp) and svp-3 (159 bp), respectively. svp-3 caused a missplicing and a 7-bp deletion in the SVP transcripts.
(E) Expression of FT, SOC1, GI, and CO in Ler wild-type, svp-3, lhy-12;cca1-101, and lhy-12;cca1-101;svp-3 plants grown under LL for 12 d. TUBULIN2 (TUB) levels are shown as controls. Open boxes represent LL conditions, and hours from the first sampling are shown.
(F) and (G) Flowering times of various mutant plants in LL.
All of these experiments were done at least twice with similar results. Data in (B), (F), and (G) are presented as means ± se.

