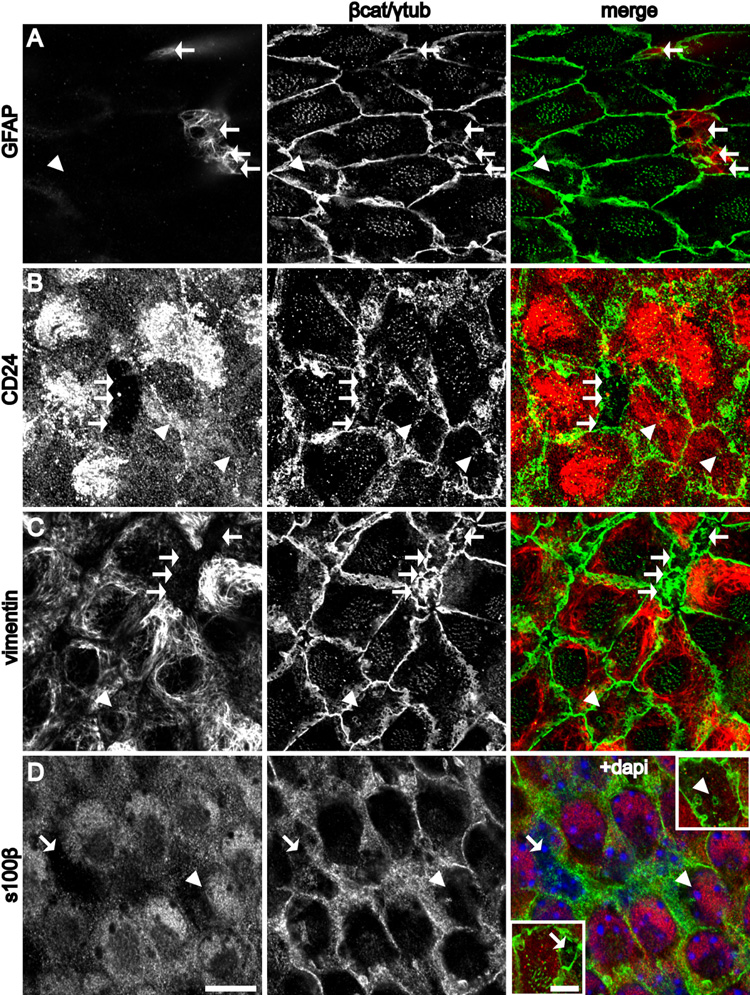
Figure 2. Complementary expression patterns of molecular markers at the apical surface of B1 and E1/E2 cells.
(A–C, D insets) Confocal images at the surface of the wholemount and (D) was taken just below the surface. B1 cells (arrows) and E2 cells (arrowheads).
(A) GFAP staining is present in B1, but not E1 or E2 cells.
(B) CD24 is expressed in the cilia and on the apical surface of E1 and E2, but not B1 cells.
(C) Vimentin is expressed at the apical surface of E1 and E2, but not B1 cells.
(D) S100β expression is observed in the cell body of E1 and E2, but not B1 cells. Insets show the apical surface of the indicated B1 and E2 cells. Scale bar = 10 um (A–D). Inset: Scale bar = 5 um.

