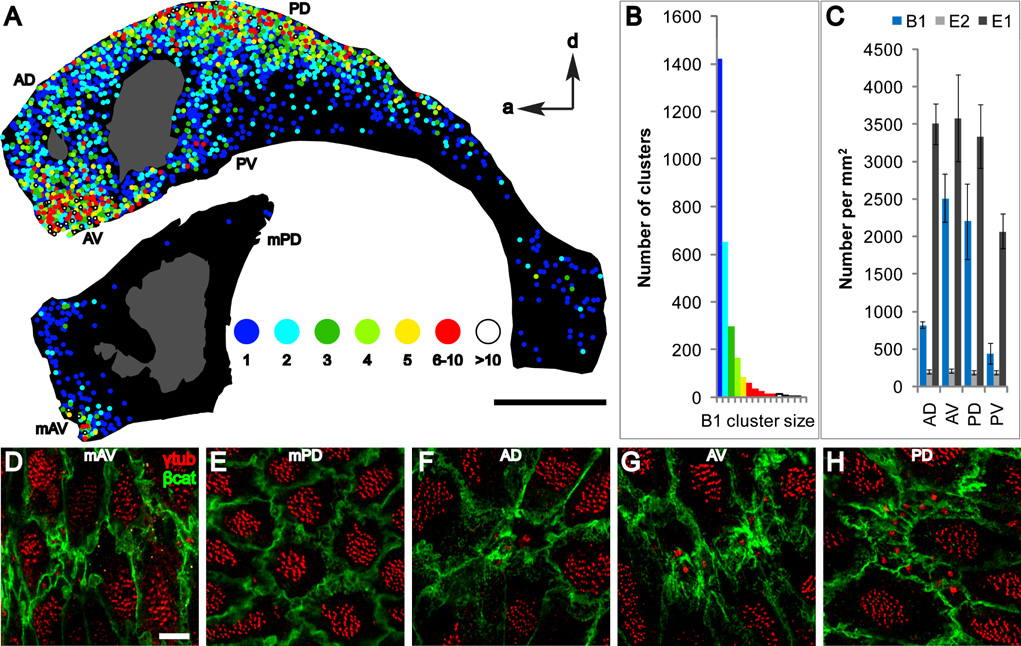
Figure 5. Surface maps of the walls of the LV reveal “hot spots” of B1 apical surfaces.
(A) The position of B1 apical surfaces is indicated on the maps by color-coded circles depicting the number of B1 apical surfaces per cluster (1 to >10 cells/cluster). Hot spots were found in anterior-ventral (AV) and posterior-dorsal (PD) regions of the lateral wall and anterior-ventral (mAV) region of the medial wall. The adhesion point between lateral and medial walls is shown in gray. Scale bar = 1 mm.
(B) Distribution of B1 cluster size.
(C) Density of B1, E1, and E2 apical surfaces in 4 regions of the lateral wall in 3 animals. Regions quantified are indicated in (A) and Figure S13. Error bars show sem.
(D–H) Representative confocal images from different regions of the surface of the lateral and medial walls stained for γ-tubulin and β-catenin. Scale bar = 5 um.

