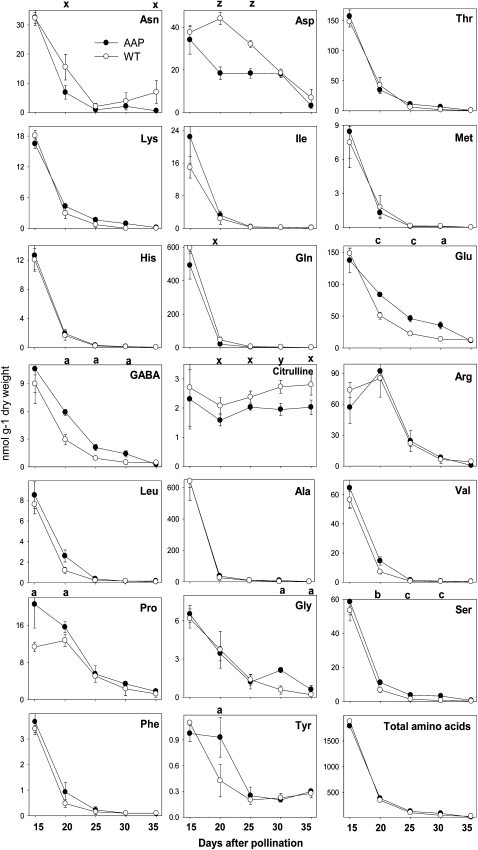
Figure 4.
Levels of free amino acids in iAGP-3 and wild-type embryos during maturation. Data points are means from four replicates ± se. Significantly higher levels according to t test are as follows: a, P < 0.05; b, P < 0.01; c, P < 0.001. Significantly lower levels according to t test are as follows: x, P < 0.05; y, P < 0.01; z, P < 0.001.

