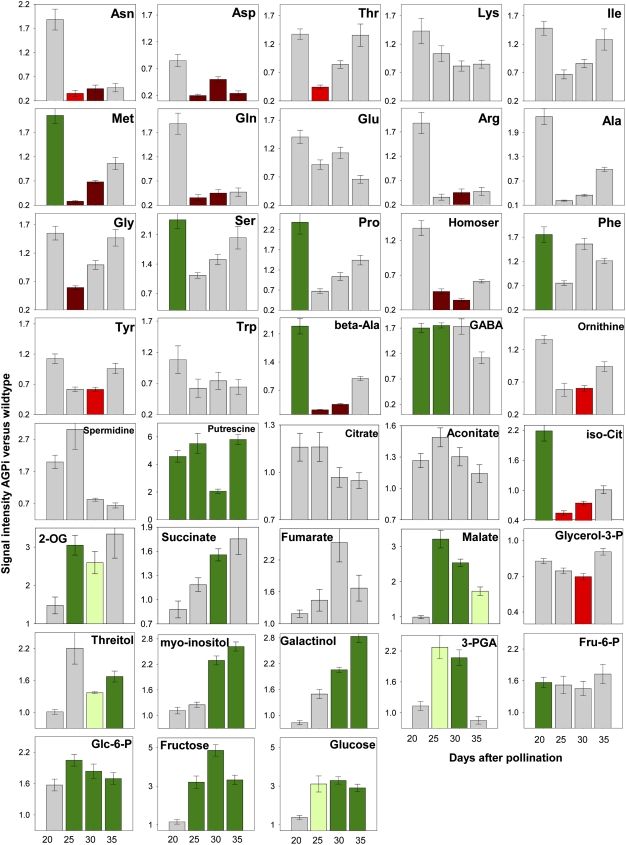
Figure 5.
Relative changes of metabolites in iAGP-3 embryos in comparison with the wild type as determined by gas chromatography-mass spectrometry. Values represent means ± sd (n = 6). Dark green bars, Increased at P < 0.05; light green bars, increased at P < 0.1; dark red bars, decreased at P < 0.05; light red bars, decreased at P < 0.1.

