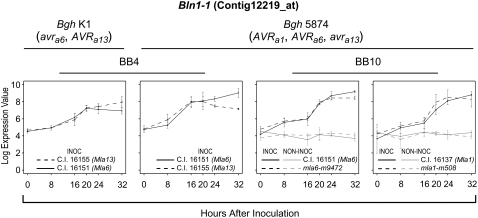
Figure 1.
Time-course expression profiles of Bln1-1 (Contig12219_at) in barley-Bgh interactions. The left two panels display data from BB4, an experiment described by Caldo et al. (2004), in which nearly isogenic barley lines harboring the contrasting Mla alleles, Mla6 and Mla13, were challenged in pairwise combinations with the alternately virulent and avirulent Bgh isolates 5874 (AVRa1, AVRa6, avra13) and K1 (AVRa1, avra6, AVRa13). A mixed linear model analysis (Wolfinger et al., 2001) using the SAS mixed procedure was conducted to identify genes whose average pattern of expression in one host-pathogen interaction category (e.g. compatibility) differed significantly from its average pattern of expression in its contrasting category (e.g. incompatibility). Time-specific differences between the average expressions (0, 8, 16, 20, 24, and 32 hai) were tested for equality using an F statistic (Caldo et al., 2004). The BB10 experiment (shown in the right two panels) compared wild-type (Mla) plants and derived loss-of-function deletion mutants inoculated with Bgh isolate 5874 (AVRa1, AVRa6). Identical noninoculated plants were included for each treatment. Normalized average signal intensities and se values were calculated based on three independent replications for both experiments. Derivations of se values are shown for illustration, as each contrast uses pooled variances when testing for significant differences between incompatible versus compatible interactions.

