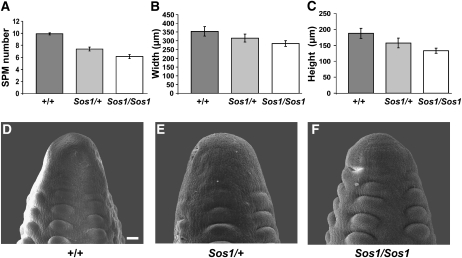
Figure 3.
Analysis of the IM of Sos1 mutants. A, Quantification of the number of SPM produced around the circumference of the tip of Sos1 ears. B, Measurement of the width of the IM. C, Measurement of the height of the IM. D to F, SEM of the IM of normal, Sos1/+, and Sos1/Sos1 ears. Scale bar = 50 μm.

