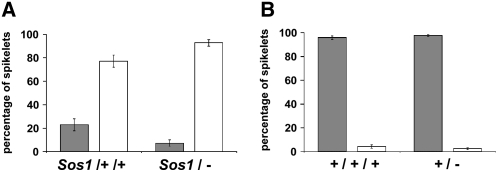
Figure 5.
Dosage analysis. A, The percentage of paired (gray bar) versus single (white) spikelets in Sos1 plants containing two copies of wild-type chromosome 4S (hyperploid) or missing the short arm of chromosome 4 (hypoploid). B, The percentage of paired (gray) versus single (white) spikelets in normal plants containing three wild-type copies of chromosome 4S (hyperploid) or one wild-type copy of chromosome 4S (hypoploid).

