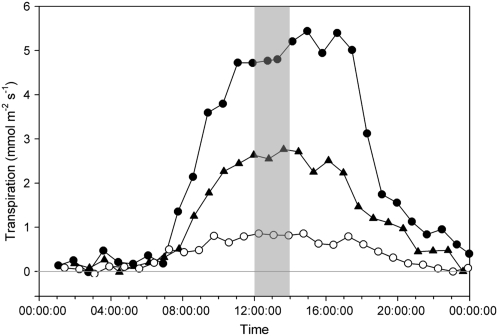
Figure 1.
Examples of diurnal patterns of whole-plant transpiration in a single individual of A. arenarius during several weeks of withholding water. The three plots show data while unstressed (Ψleaf = −1.15 MPa; black circles), moderately stressed (Ψleaf = −1.65 MPa; triangles), and stressed to >80% stomatal closure (Ψleaf = −2.85 MPa; white circles). Emd was measured during the shaded time interval.

