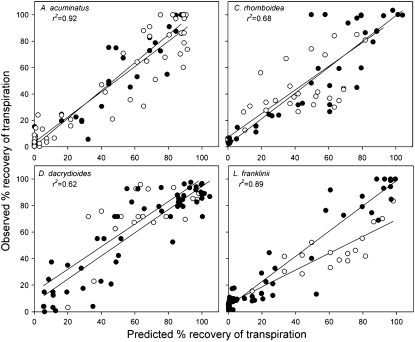
Figure 6.
Predicted and observed recovery of Emd (white circles) in all plants after rewatering from all levels of drought. Predicted and observed %Emd are shown simultaneously (black circles) for plants during the droughting phase as well to provide a comparative data set showing stomatal control of gas exchange under limiting soil water content. All plants showed good correlation between observed and predicted %Emd during drought recovery. Only in L. franklinii was there any significant difference in the slopes between recovery and droughting datasets.

