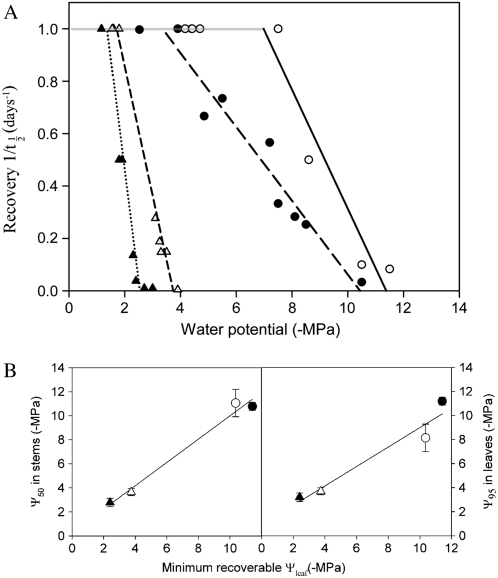
Figure 7.
A, The relationship between recovery time (plotted as t1/2−1) and final Ψleaf prior to rewatering in all individuals of A. arenarius (white circles), C. rhomboidea (black circles), D. dacrydioides (black triangles), and L. franklinii (white triangles). Recovery time showed two phases, the first phase was insensitive to Ψleaf (1/t1/2 = 1) and the second highly dependent. Linear regressions fitted through this second phase as t1/2 fell from 1 (overnight recovery of t1/2) to 0 (plant death). The x intercept of these regressions was defined as the minimum recoverable water potential (Ψmin). B, Shows the very highly significant 1:1 relationships between Ψmin derived from A and 50% loss of Kstem (r2= 0.98) and 95% loss of Kleaf (r2=0.94), symbols as in A. Correlation coefficients are for regression lines forced through the origin.

