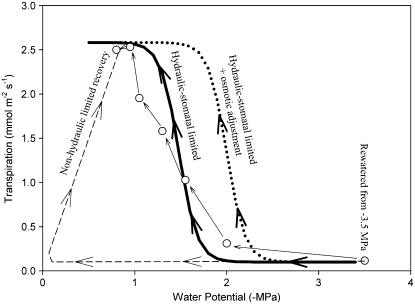
Figure 8.
Examples of measured (white circles) and modeled (lines) recovery trajectory of transpiration in a L. franklinii plants over 20 d following rewatering from drought (−3.5 MPa). Three curves depict three models of stomatal-hydraulic behavior: the hydraulic-stomatal limitation model with a fixed E = f(Ψleaf) (bold line); a hydraulic-stomatal limitation model with osmotic adjustment to promote stomatal opening at lower Ψleaf (dotted line); and a nonhydraulic limited recovery where stomatal sensitivity to Ψleaf is enhanced or nonexistent postdrought, e.g. as might occur if ABA was limiting stomatal aperture (dashed line). The measured recovery response for this individual and all individuals (Fig. 6) was best described by the constant E = f(Ψleaf) function.

