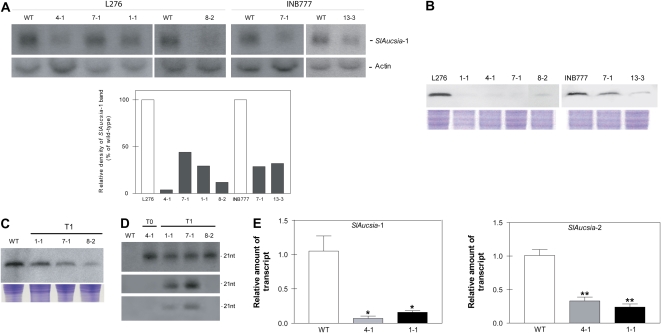
Figure 2.
Molecular analysis of Aucsia-silenced plants. A (top), Northern blot analysis of SlAucsia-1 mRNA steady-state levels in leaves of six independent lines (belonging to two different genetic backgrounds, L276 and INB777) transgenic for the rolC-hpAucsia construct. A (bottom), Densitometric analysis performed on northern blot. The relative density of SlAucsia-1 bands was normalized against actin bands and reported as a percentage of the density of the corresponding wild-type (WT) bands. B, Western-blot analysis of protein extracted from flower buds of rolC-hpAucsia transgenic plants (T0) raised in two different genetic backgrounds (L276 and INB777). The four L276 transgenic plants analyzed are L276 1-1, 4-1, 7-1, and 8-2. The two INB777 transgenic plants analyzed are INB777 7-1 and 13- 3. C, Western-blot analysis of AUCSIA-1 peptide in three T1 independent L276 Aucsia-silenced lines: L276 1-1, 7-1, and 8-2. Top, AUCSIA-1 peptide analysis; bottom, Coomassie Brilliant Blue staining of total protein. D, Presence of siRNAs homologous to SlAucsia genes in leaves of T0 and T1 silenced lines (L276 genetic background). Top, siRNAs homologous to the SlAucsia-1 coding region; middle, siRNAs homologous to the 3′ UTR of SlAucsia-1 transcript; bottom, siRNAs homologous to the 3′ UTR of SlAucsia-2 transcript (see Supplemental Fig. S1A for a description of RNA probes). E, SlAucsia-1 and SlAucsia-2 steady-state mRNA levels in preanthesis flower buds from two Aucsia-silenced independent lines (L276 4-1 and 1-1). The relative mRNA levels were assessed by qRT-PCR in Aucsia-silenced plants compared with wild-type plants. Error bars in E represent sd. * P < 0.05, ** P < 0.01. [See online article for color version of this figure.]

