Figure 3.
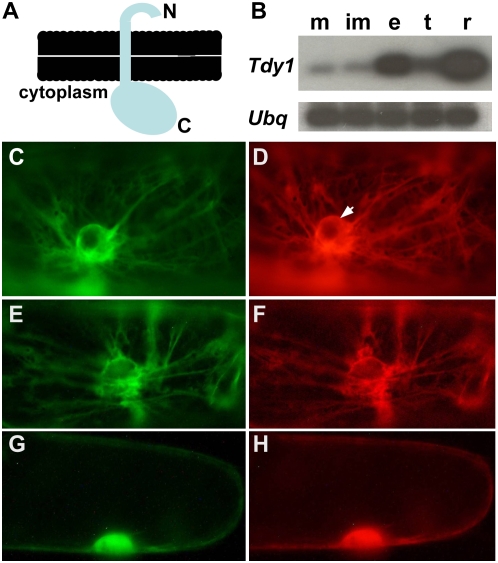
RT-PCR of Tdy1 RNA in maize tissues and TDY1 protein subcellular localization in onion cells. A, Cartoon of TDY1 topology showing the N terminus on the luminal side of the membrane and the C terminus on the cytoplasmic face. B, Semiquantitative RT-PCR blots showing expression of Tdy1 and Ubq as a loading control in B73 wild-type tissues. m, Mature leaves; im, immature leaves; e, developing ear; t, developing tassel; r, 1-week-old roots. C to H, Fluorescent proteins transiently expressed in onion epidermal cells. C, ER membrane-targeted GFP-HDEL (Goodin et al., 2007). D, Same cell as in C coexpressing the full-length TDY1-RFP fusion, showing colocalization to the ER. The arrow indicates the perinuclear envelope, which is contiguous with the ER. E, N-terminal amino acids 1 to 71 of TDY1 fused to YFP showing ER localization. F, Same cell as in E coexpressing full-length TDY1-RFP fusion. G, C-terminal amino acids 72 to 272 of TDY1 fused to YFP localizes in the cytoplasm and nucleus. H, Same cell as in G coexpressing soluble RFP in the cytoplasm and nucleus. [See online article for color version of this figure.]

