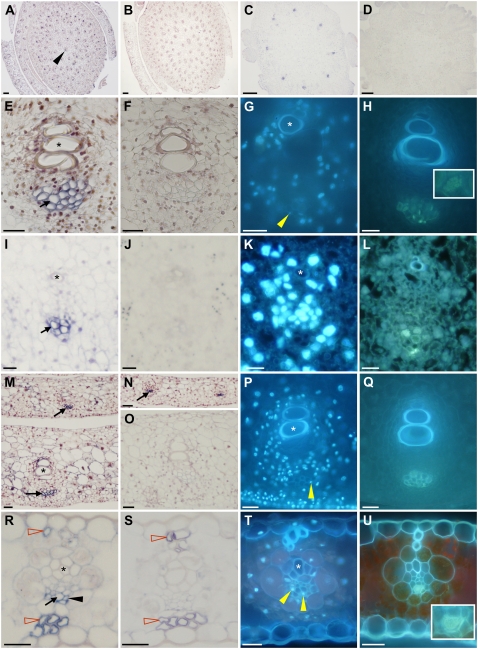
Figure 4.
Tdy1 RNA in situ hybridizations. All tissues are from B73 wild-type plants except D, which is from a tdy1-D6 deletion control. A, C, D, E, I, M, N, and R, Tissue sections probed with antisense Tdy1 RNA. Blue precipitate indicates signal (black arrows). B, F, J, O, and S, Tissue sections probed with Tdy1 sense strand control. A and B, Young stems and surrounding immature leaves. The black arrowhead indicates a vein. C and D, Developing ears. E to H, Veins in developing stem tissue. I to L, Veins in developing ears. M to Q, Veins in immature leaves. R to U, Veins in mature leaves. G, K, P, and T, DAPI-stained veins. Yellow arrowheads indicate DAPI-positive CC nuclei. H, L, Q, and U, Aniline blue-stained veins. Insets in H and U show aniline blue-stained sieve plates. Asterisks indicate xylem elements. N, Tdy1 expression in protophloem cells prior to protoxylem differentiation. R, Tdy1-expressing CC (black arrowhead) and SE (black arrow) as judged by their appearance, position, and relative size within the phloem. Red-outlined arrowheads indicate nonspecific signal in thick-walled hypodermal sclerenchyma cells. Bars = 100 μm in A to D and 25 μm in E to U.

