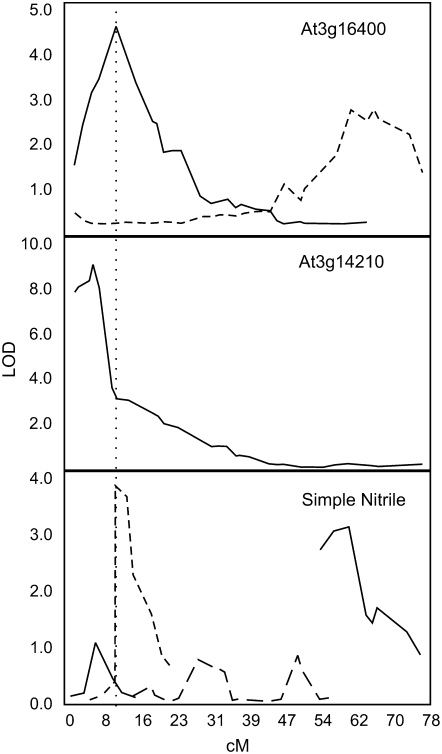
Figure 8.
Expression and phenotypic QTLs in the Arabidopsis Bay-0 × Sha RIL population. QTLs on chromosome III governing the expression of AtNSP1 (At3g16400) and ESM1 (At3g14210) and the formation of simple nitriles are shown. Different line styles (dashed, solid, etc.) show independent QTLs for each phenotype and the QTL significant conditional likelihood profiles as identified by the MIM module of QTL Cartographer. The vertical line through the three graphs shows the physical position of At3g16400 as determined by high-resolution mapping. This analysis focused only on chromosome III for clarity and precision. cM, Centimorgan position along chromosome III; LOD, logarithm of the odds.

