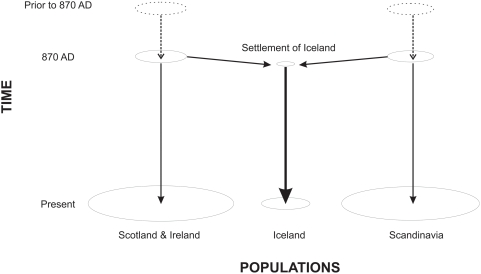
Figure 1. A schematic representation of Iceland's population history.
The circles represent the gene pools of the Scottish and Irish, Icelandic and Scandinavian population groups at different points in time. Circle diameter broadly reflects the relative population sizes. The vertical arrows represent the transmission of DNA between generations within populations, while the diagonal arrows represent the settlement of Iceland from 870 to 930 AD from Scotland, Ireland and Scandinavia.

