
Figure 2. H2O2 induced apoptosis in RIE-1 cells.
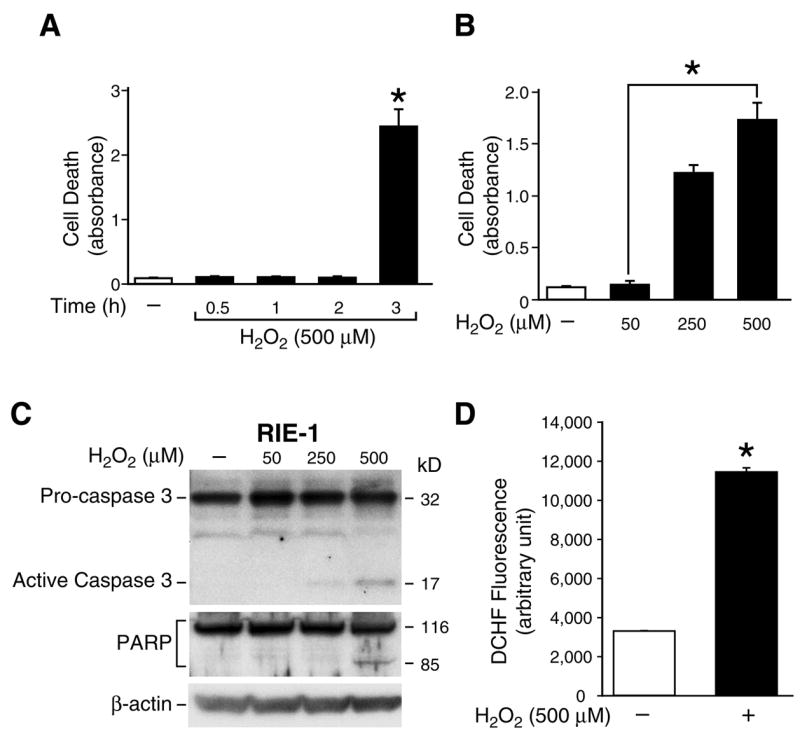
(A) RIE-1 cells were treated with or without H2O2 (500 μM) in normal growth medium over a time course and cell death assays performed. Experiments were performed in triplicate and results are expressed as mean ± SEM (n=3); * p< 0.05 vs. control (−). (B) RIE-1 cells were treated with or without various doses of H2O2 in normal growth medium for 3 h and cell death assays performed. Experiments were performed in triplicate and results are expressed as mean ± SEM (n=3); * p< 0.05 vs. control (−). (C) RIE-1 cells were treated with or without various doses of H2O2 in normal growth medium for 3 h. Both attached and floating cells were collected, lysed and Western blot analysis was performed for the expression of caspase 3 or PARP cleavage products; β-actin protein expression was detected to monitor equal loading. (D) RIE-1 cells were loaded with DCFH/DA (50 μM) for 30 min and were subsequently exposed to H2O2 (500 μM) for 3 h. Cellular fluorescence in each well was measured and immediately recorded. The DCFH fluorescence increased in H2O2-exposed cells. Results are expressed as mean ± SEM (n=3); * p< 0.05 vs. control (−).