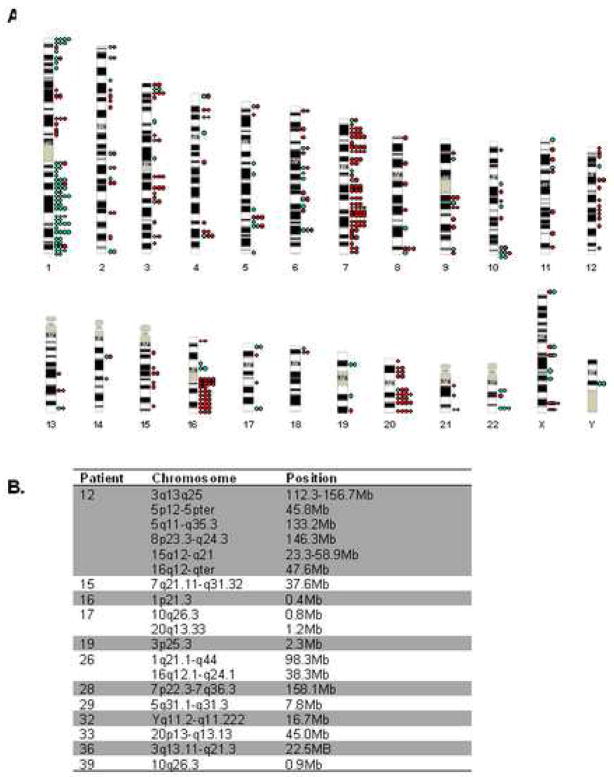
Figure 5. Genome-wide view of chromosomal lesion as detected by A-CGH in patients with MDS.
A. Each dot represents a single change in a single BAC in a single patient. Gains are indicated by green and loss red. Due to the level of resolution of the chromosome ideograms lesions are grouped by band and not BAC. B. Patients that were found to harbor large changes in contiguous BACs are shown. Although many were previously identified by traditional karyotyping techniques, novel changes were found.

