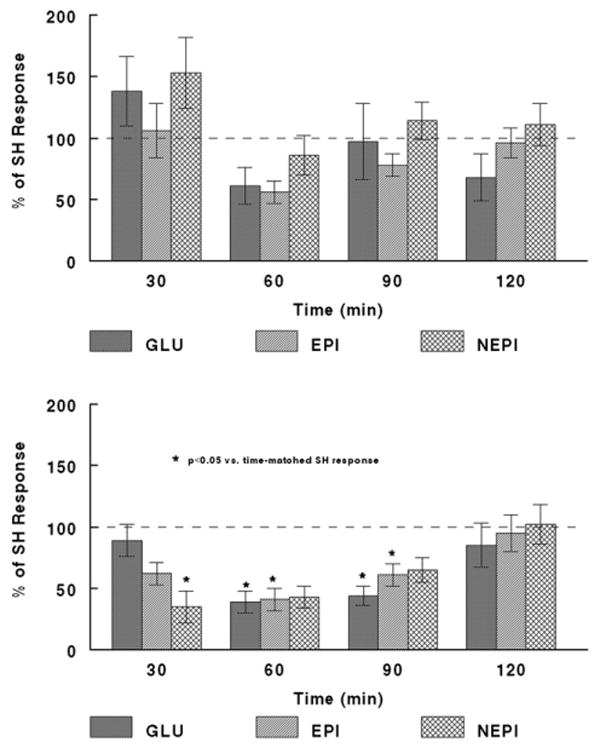
Fig. 2.

Comparison of Glucagon, EPI, and NEPI responses to single or recurrent hypoglycemia with PBS or LIDO infusion into the THPVP. Upper: Glucagon, EPI, and NEPI responses to recurrent hypoglycemia (RH) are comparable to those in rats experiencing a single (naive) bout of hypoglycemia (SH), when PBS is infused into the THPVP. Data for RH subjects are expressed as a % of the identical, time-matched responses for SH subjects (all mean SH responses being set to ‘100%’), and are shown as mean±standard error of the mean. See Table 1 and Results for group sizes. Lower: Glucagon, EPI, and NEPI responses to RH are decreased relative to those of rats experiencing a single (naive) bout of hypoglycemia (SH), when LIDO is infused into the THPVP. Data for RH subjects are expressed as a % of the identical, time-matched responses for SH subjects (all mean SH responses being set to ‘100%’), and are shown as mean±standard error of the mean. See Table 1 for group sizes. ‘*’ indicates p<0.05 vs. SH response, at the timepoint indicated.
