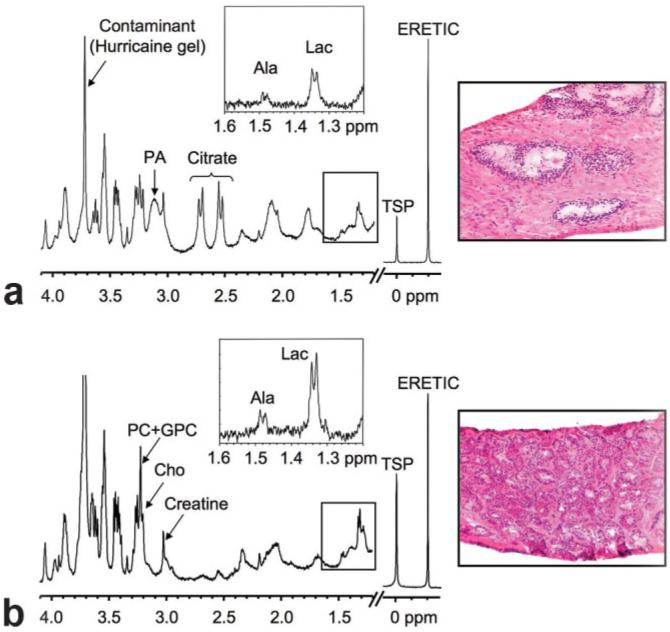
FIG. 1.
Representative 1H HR-MAS spectra and corresponding histopathologic sections of (a) benign predominantly glandular (40% glandular, 60% stroma) and (b) prostate cancer (70% Gleason 3+3) biopsy tissues. The major metabolites, TSP, and ERETIC resonances are shown. Lactate to alanine regions from 144-ms CPMG spectra are shown inset.

